UKRAINIAN PHARMA
TRENDS AND DYNAMICS
Introduction
The Ukrainian pharmaceutical sector has demonstrated remarkable resilience and adaptability in the face of wartime challenges.
It now encompasses over 3,900 companies. Despite shelling, disrupted supply chains, and threats to personnel and production facilities, domestic firms have not only maintained an uninterrupted supply of nearly 15,000 essential medicines but have also modernized production processes, entered export markets, and invested in developing new pharmaceutical products.
This CNA analysis examines the current state of the sector, shifts in quantitative and qualitative metrics across company groups, key trends, and selected aspects of legislative implementation. The review covers the period from 2020 to 2024.
Company Count Dynamics and Group Distribution
The onset of the full-scale invasion served as a stress test for the national economy. The response underscored the resilience of Ukrainian enterprises, with the number of pharmaceutical companies rising by 461 (13.2%) since 2021.
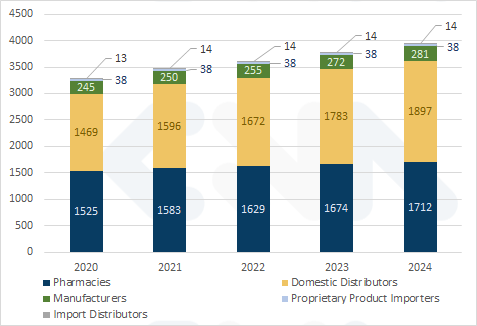
By the end of 2024, Ukraine had registered nearly 1,900 distributors of domestically produced goods, 1,700 pharmacies and pharmacy chains, and over 280 domestic manufacturers of medicines and other pharmaceutical products.
Dynamics of Pharmaceutical Sector Enterprises, 2020–2024
Growth Rates
Over three years of conflict, the number of market participants grew significantly.
By the end of 2024, 3,942 pharmaceutical companies operated in Ukraine—a 13.2% increase over 2021, the final pre-war year.
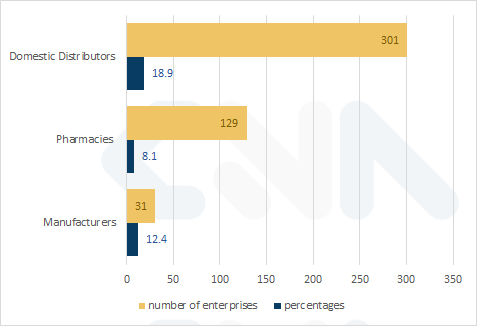
The most rapid expansion occurred among distributors, which saw an 18.9% rise. More than 300 new enterprises joined this group, totaling 1,897 companies by the end of 2024.
Manufacturers ranked second with a 12.4% increase; their count grew by 31 companies, reaching 281.
Pharmacies and pharmacy chains added 129 businesses (8.1%) over three years, totaling 1,712 companies.
The number of import distributors and proprietary product importers remained flat at 14 and 38 firms, respectively, as of late 2024.
Increase in Numbers of Manufacturers, Pharmacies, and Distributors During the Full-Scale Invasion (2022–2024)
Sector Structure
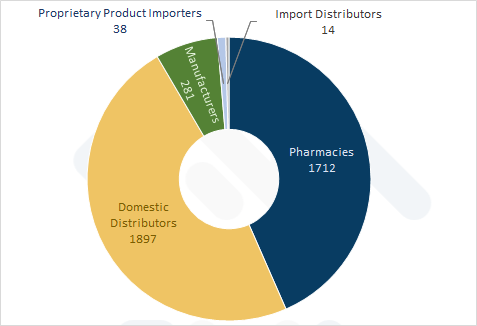
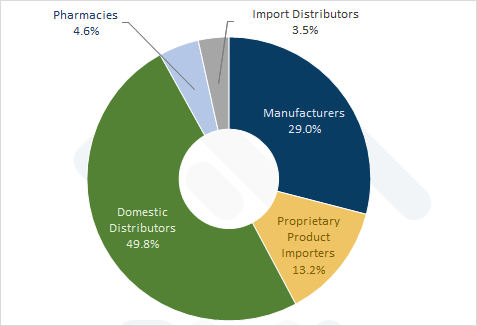
By the end of 2024, distributors comprised the largest share of firms (48.1%), followed by pharmacies and pharmacy chains (43.4%). Manufacturers represented 7.1%, and each importer category accounted for under 1%.
Sector Structure by Activity Type, 2024
Revenues
Trends and Patterns
Revenue trends across all groups followed a similar trajectory: declines during the Q2 2020 crisis and after hostilities began in Q1–Q2 2022, then consistent growth thereafter.
Quarterly Revenue Dynamics by Company Group (Q1 2020–Q4 2024)
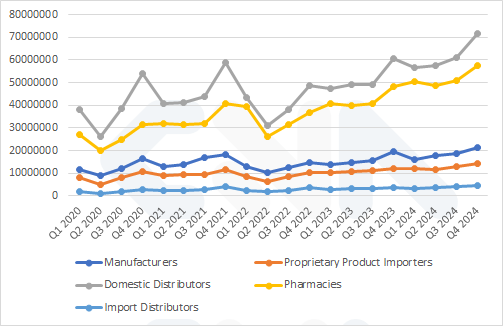
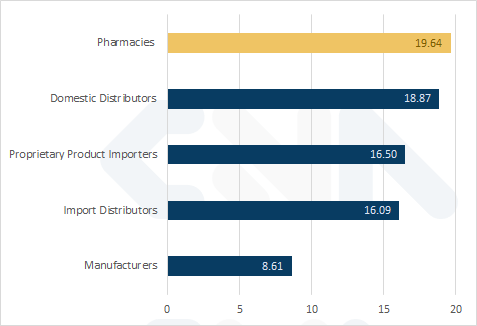
Notably, revenues for pharmacies and domestic distributors rose sharply—19.6% and 18.9%, respectively, between Q4 2023 and Q4 2024.
Manufacturers saw the smallest increase at 8.6%.
Annual Revenue Growth (Q4 2023–Q4 2024)
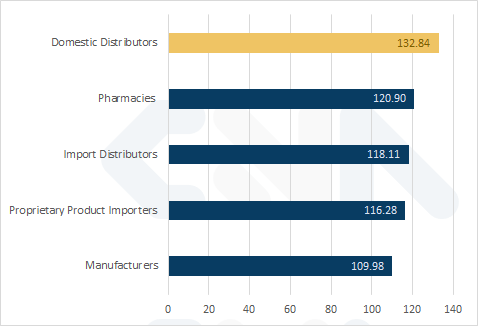
From the sector’s low in Q2 2022 to Q4 2024, distributor revenues climbed 132.8%, and pharmacy revenues increased 120.9%, both well above pre-war levels.
Revenue Growth During the Full-Scale Invasion (Q2 2022–Q4 2024)
Revenue Distribution by Group
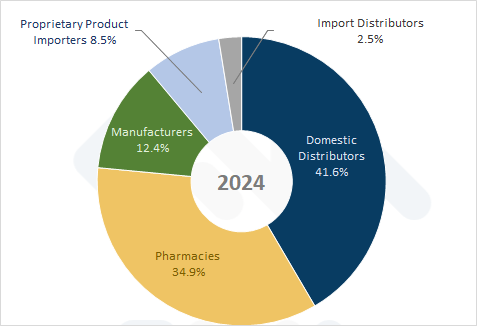
In 2024, pharmacies and domestic distributors together accounted for over 75% of sector revenues, totaling UAH 454.7 billion.
Manufacturers contributed 12.4% (UAH 73.8 billion), proprietary product importers 8.5%, and import distributors 2.5%.
Revenue Distribution Structure, 2024 (%)
Profits
Trends and Patterns
Profit dynamics reveal a new leader: until late 2021, manufacturers topped profits, but since Q1 2022 domestic distributors have held the lead.
Quarterly Profits by Company Group (Q1 2020–Q4 2024)
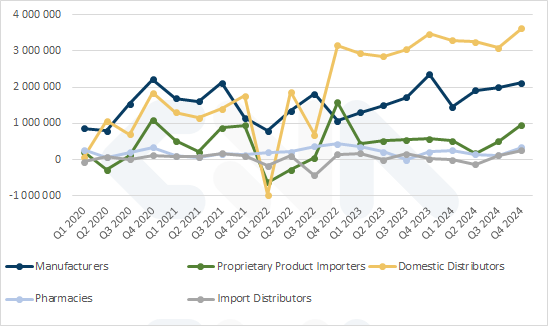
The pre-war peak was Q4 2020 at UAH 1.84 billion; by Q4 2024 it nearly doubled to UAH 3.63 billion, a 1.97× increase.
At the start of the invasion (Q1 2022), profits dipped to a UAH 971 million loss.
Profit Structure
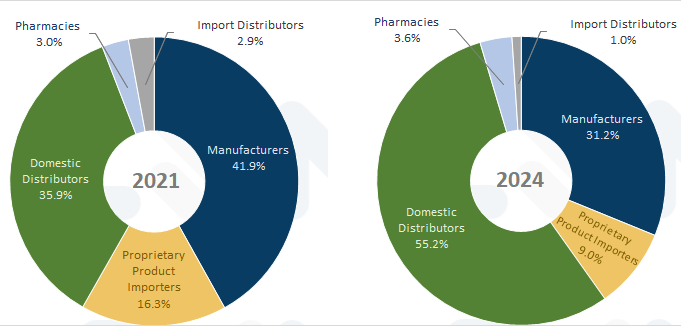
Profit Structure by Company Group, Q4 2024 (%)
By the end of 2024, domestic distributors captured 55% of industry profits (UAH 13.26 billion), surpassing the 50% threshold.
Manufacturers, pharmacies, proprietary product importers, and import distributors together accounted for under 45% (UAH 10.75 billion).
Compared to 2021, manufacturers’ profit share fell from 42% to 31%, proprietary product importers from 16% to 9%, and import distributors from 3% to 1%.
Profit Distribution Structure by Group (%)
Total industry profit in 2024 was UAH 24.0 billion: domestic distributors earned UAH 13.26 billion, manufacturers UAH 7.48 billion, proprietary product importers UAH 2.17 billion, pharmacies UAH 0.86 billion, and import distributors UAH 0.25 billion.
Pharmaceutical Sector in Ukraine’s Employment Structure
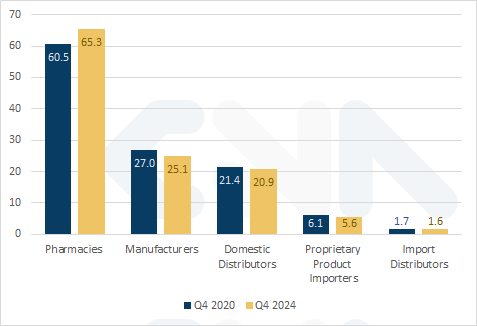
In Q4 2024, pharmaceutical industry employment totaled 118.4 thousand, representing 2.3% of Ukraine’s 5.07 million officially employed individuals (CNA study “Economy 2020–2024: Financial Indicators of Ukrainian Enterprises”).
Pharmacies provided the most jobs (65.3 thousand), followed by manufacturers (25.1 thousand) and distributors (20.9 thousand).
Employment Trends by Sector (Q4 2020–Q4 2024, thousands)
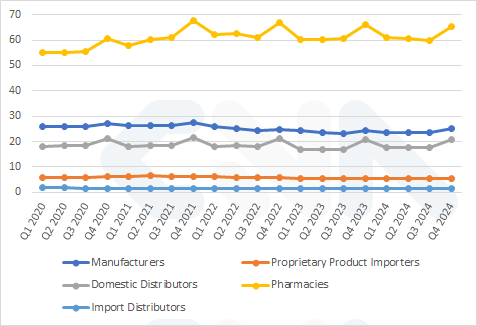
Over four years, pharmacy companies added 7.9% (4.8 thousand jobs), while other groups saw declines: proprietary product importers down 8.8% (0.5 thousand) and manufacturers down 7.0% (1.9 thousand).
Comparison of Employment Levels, Q4 2020–Q4 2024 (thousands)
Drug Price Regulation Since March 1, 2025: Interim Results
Since March 1, 2025, Ukraine has implemented state price regulation for a range of popular medicines. The decision, initiated by President Volodymyr Zelensky and approved by the National Security and Defense Council and the Cabinet, aims to stabilize consumer prices.
In February 2025, Ukrainian pharmaceutical manufacturers signed the Declaration on price reduction and stabilization of medicines. Under this agreement, price cuts for each listed product were negotiated individually with each manufacturer.
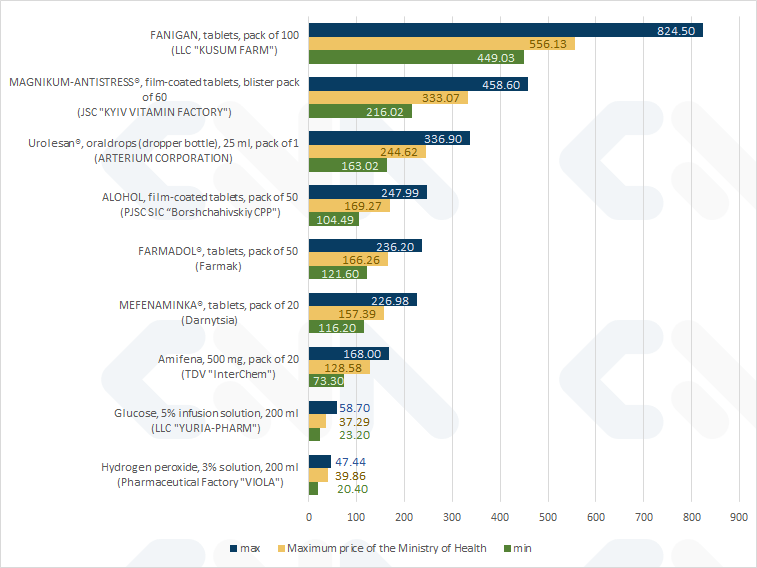
CNA analyzed prices for items on the Ministry of Health’s “Top-100 Drugs with Reduced Prices” list to assess the regulation’s effectiveness. The study examined randomly selected products in Kyiv pharmacies* as of July 11, 2025, focusing only on medicines from Ukrainian manufacturers that signed the Declaration and reduced prices.
Note: The full list of drugs and maximum consumer prices, including allowable markups, is available on the Ministry of Health website.
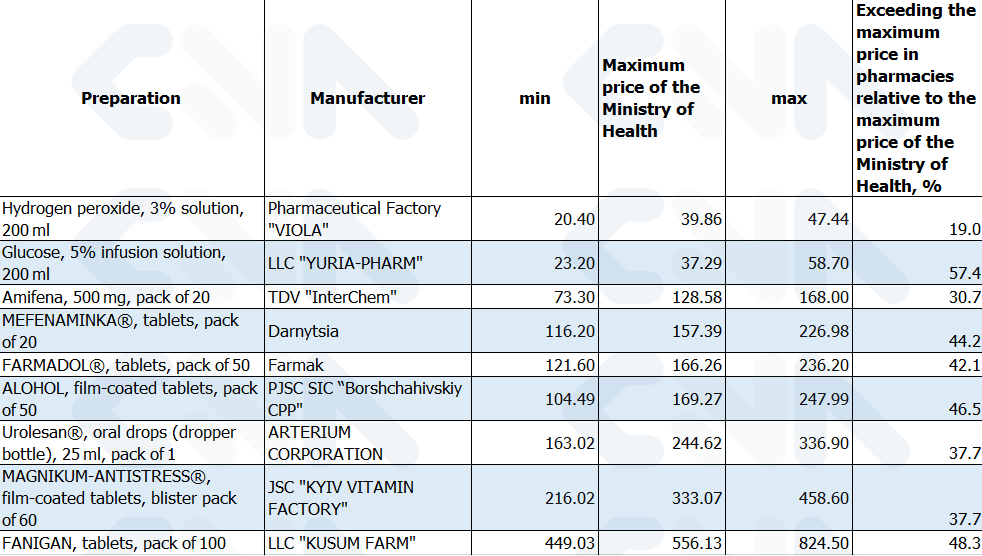
Prices of Selected Drugs in Kyiv Pharmacies (UAH)
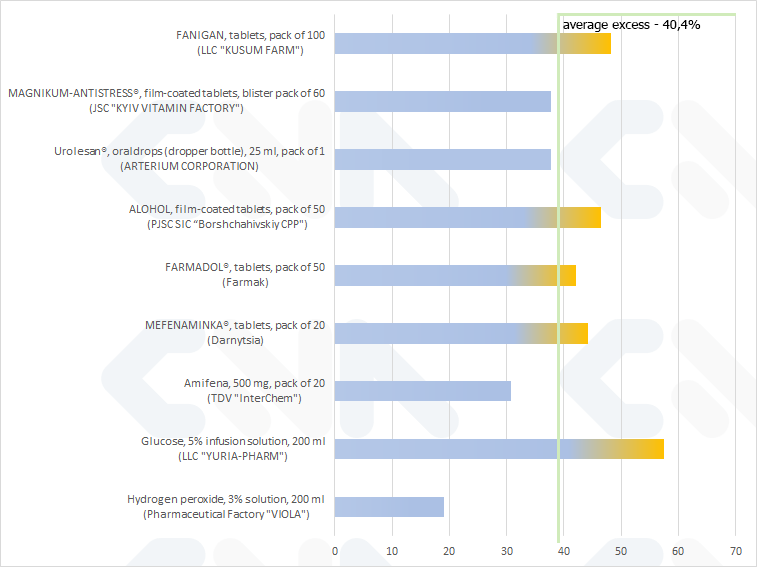
Percentage Exceedance of the MOH Maximum Price in Pharmacies (%)
* Based on data from Tabletki.ua monitoring.
Conclusions
In every case studied, Kyiv pharmacies’ retail prices exceeded the MOH-agreed maximum price.
As of July 11, 2025, the average exceedance was 40.4%, with the highest reaching 57.4%.
Executive Summary
Today, Ukrainian pharmaceuticals are not just an economic sector but a pillar of national security. Despite ongoing challenges, the industry continues to produce high-quality products, create jobs, and remain competitive globally under wartime conditions.
Terminology
For greater precision, we distinguish between distributors of domestic and imported pharmaceutical products, as well as distributors representing a single foreign company.
The groups are defined as follows:
• Pharmacies and Pharmacy Chains – legal entities whose primary activity is classified under KVED 47.73 (retail trade of pharmaceutical goods); this refers to entities, not individual outlets or kiosks;
• Manufacturers – domestic producers of medicines and pharmaceutical products;
• Domestic Distributors – distributors focusing on medicines produced in Ukraine;
• Import Distributors – distributors focusing on imported products;
• Proprietary Product Importers – Ukrainian representatives responsible for importing and managing specific foreign products.
About the Project
CNA for Business: Objectives and Purpose
CNA products support strategic development and investment planning by providing reliable data and insights.
All data are collected from open sources, undergo multi-factor verification, and are presented in a user-friendly format.
General digests like this, as well as client-specific research, rely on OSINT analysis and the expertise of agency analysts.
Independence of Analysis
CNA is an independent agency, neither state-funded nor a recipient of financial aid.
Plans and Proposals
With over 20 years of experience, CNA maintains extensive datasets updated from dozens of sources. Their analysis supports agent vetting, decision preparation, and strategic planning.
We will continue releasing digests focused on specific aspects of the Ukrainian economy and enterprise activities.
For in-depth analysis, industry breakdowns, or forecasts, CNA experts can provide data in clear formats, including tables, charts, and infographics.